
Statewide Database
Re-designed California’s Statewide Database website: a platform dedicated to providing free, nonpartisan census data to all.
Role: Product Designer
Team: 1 Product Manager, 1 Software Engineer
Tools: Figma, Optimal Sort
Methods: Heuristic analysis, card sort, wireframing, user flow, style guide
Summary
Every ten years, local governments use new census data to redraw district lines to reflect how local populations have changed. The Statewide Database (SWDB) aggregates all of this data for California.
Problem: Although SWDB’s mission is to empower all with data access, novice and expert users struggle to understand and/or locate useful data.
Goal: Make it easier for researchers to quickly source data, and for novices to intuitively understand the database offerings.
Solution:
Actionable homepage content for both user groups
Augmented navbar to locate content
Filterable data tables to efficiently access data
Style guide to aid website comprehension
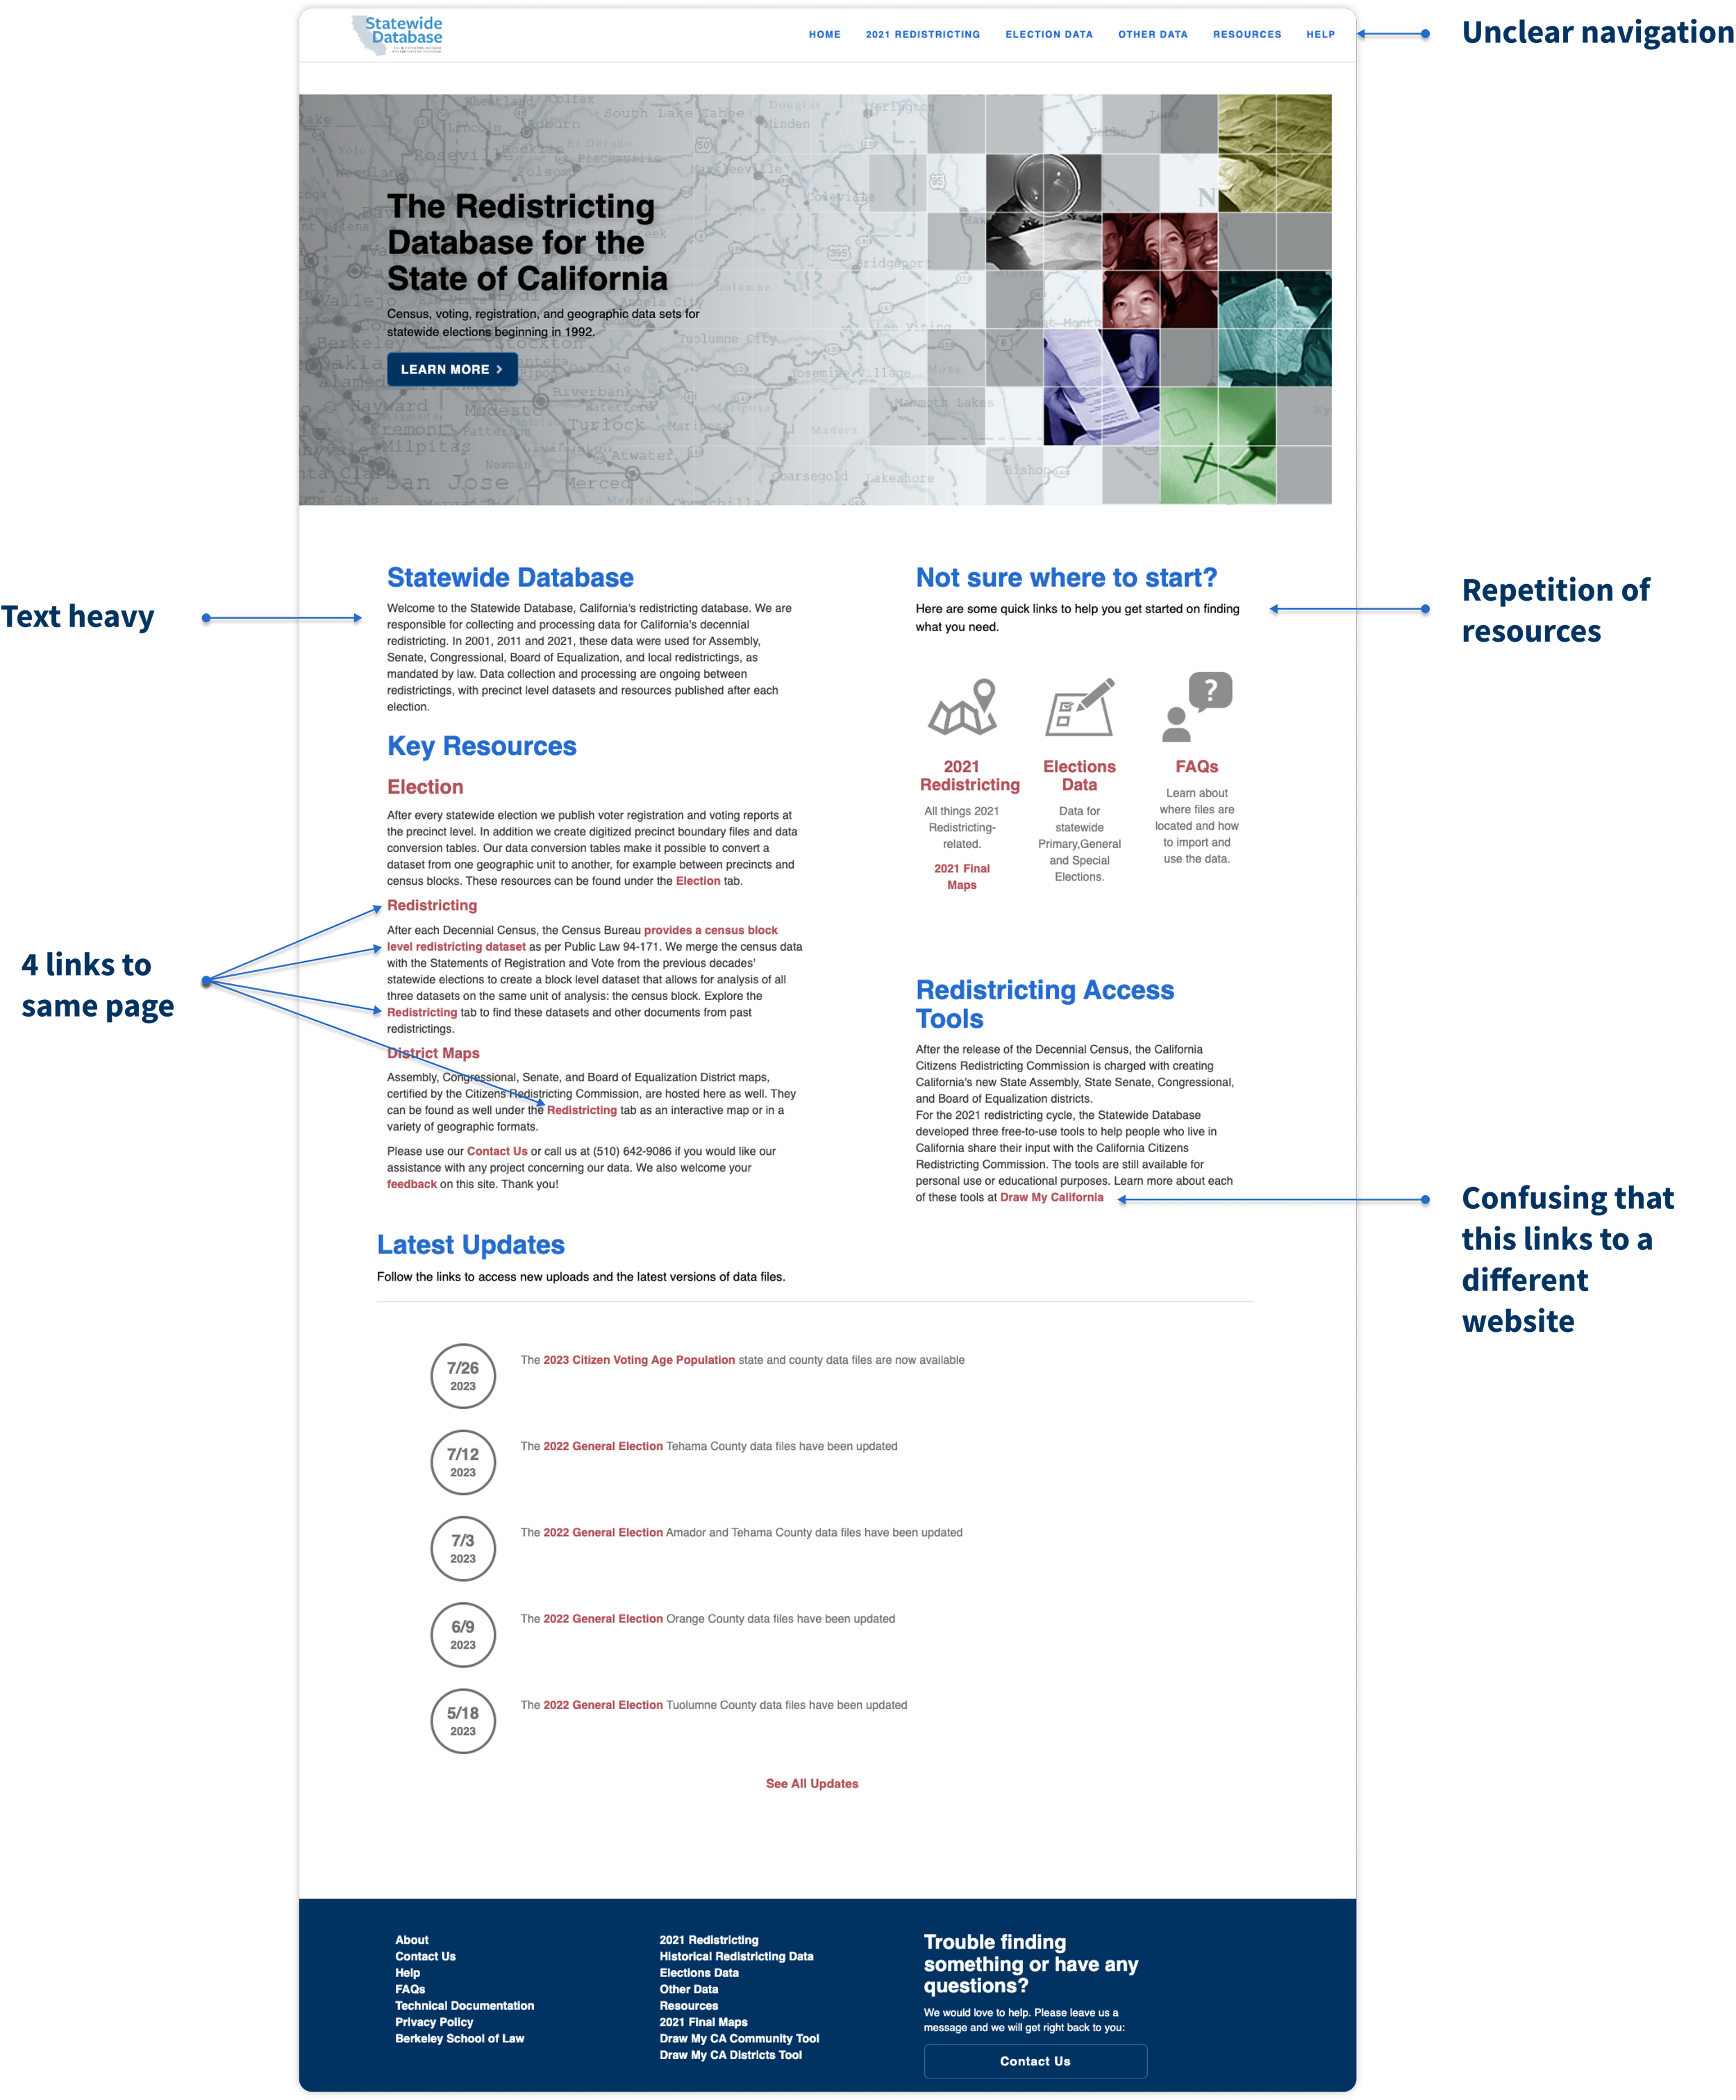
Heuristic Analysis
A heuristic analysis of the website helped familiarize with the existing website and identify 3 core opportunities to improve the homepage UX:
Reduce content & link repetition
Add visuals to inform users with less text
Reorganize navigation to help locate content
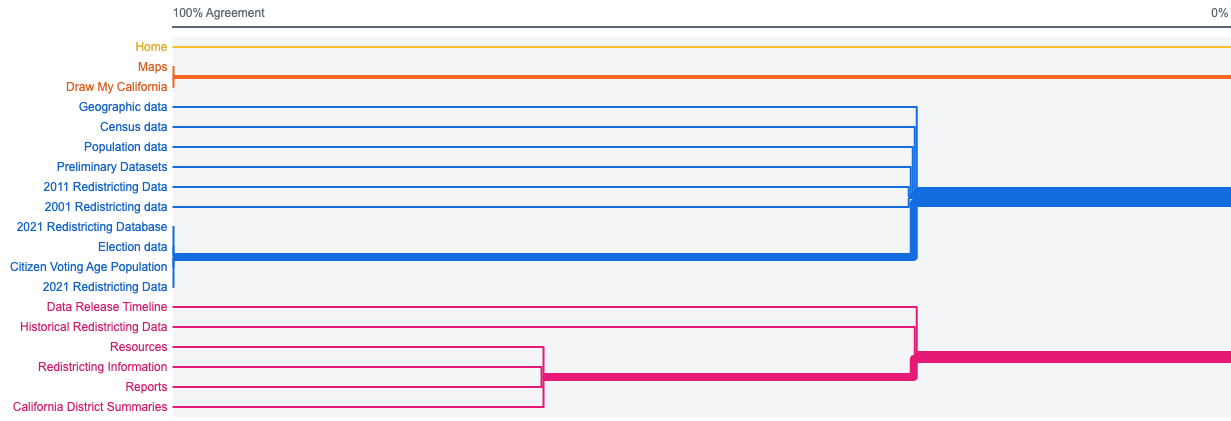
Discovery Interviews
I spoke with three SWDB users (experts) and three non-users studying Political Science (novices) to understand the needs of both user groups. The test included an Open Card Sort to understand how to redefine the website navigation.
Four groups emerged from the card sort: Data, resources/help, maps, home
Interview findings:
Insight: Experts enter via homepage and memorize a series of clicks to reach their desired dataset. When they forget the series of clicks they remember using trial and error.
Requirement 1: The homepage must help experts locate data
Insight: Users cannot precisely filter data and must develop tools to eliminate unnecessary data.
Requirement 2: Data filtering would save researchers time
Insight: Novice users expect demonstrations and documentation to understand SWDB’s offerings.
Requirement 3: The homepage should summarize SWDB’s offerings
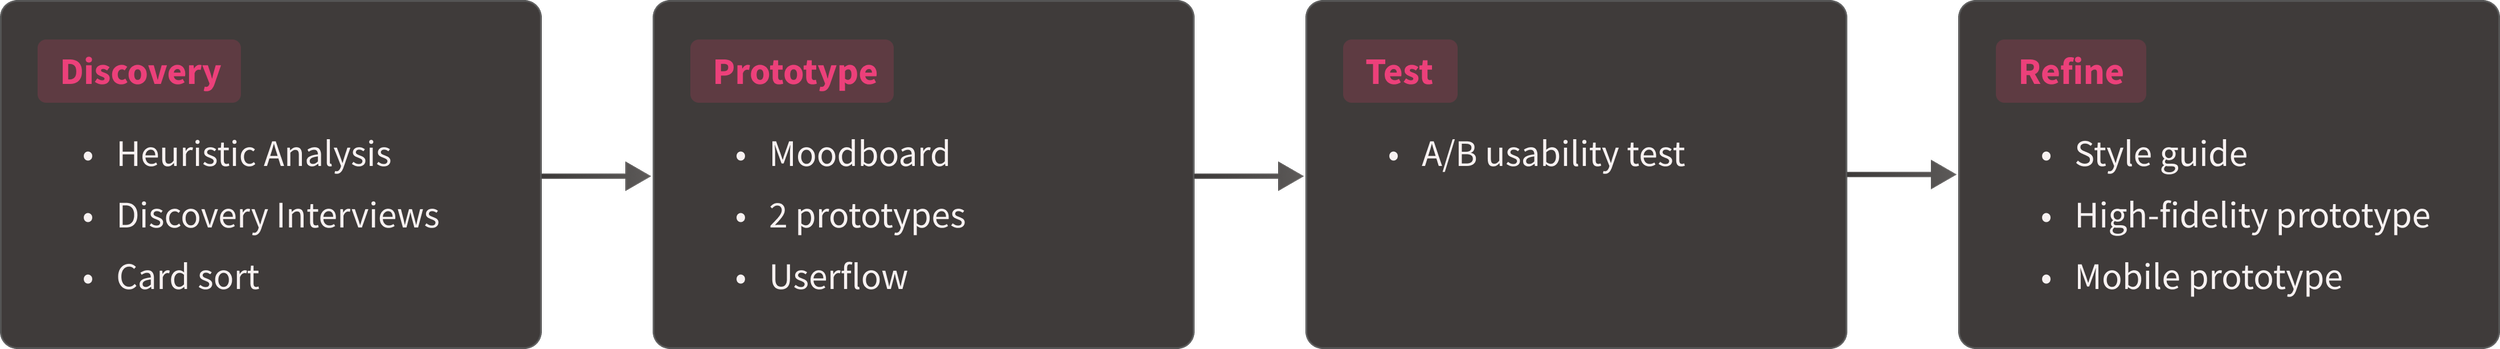
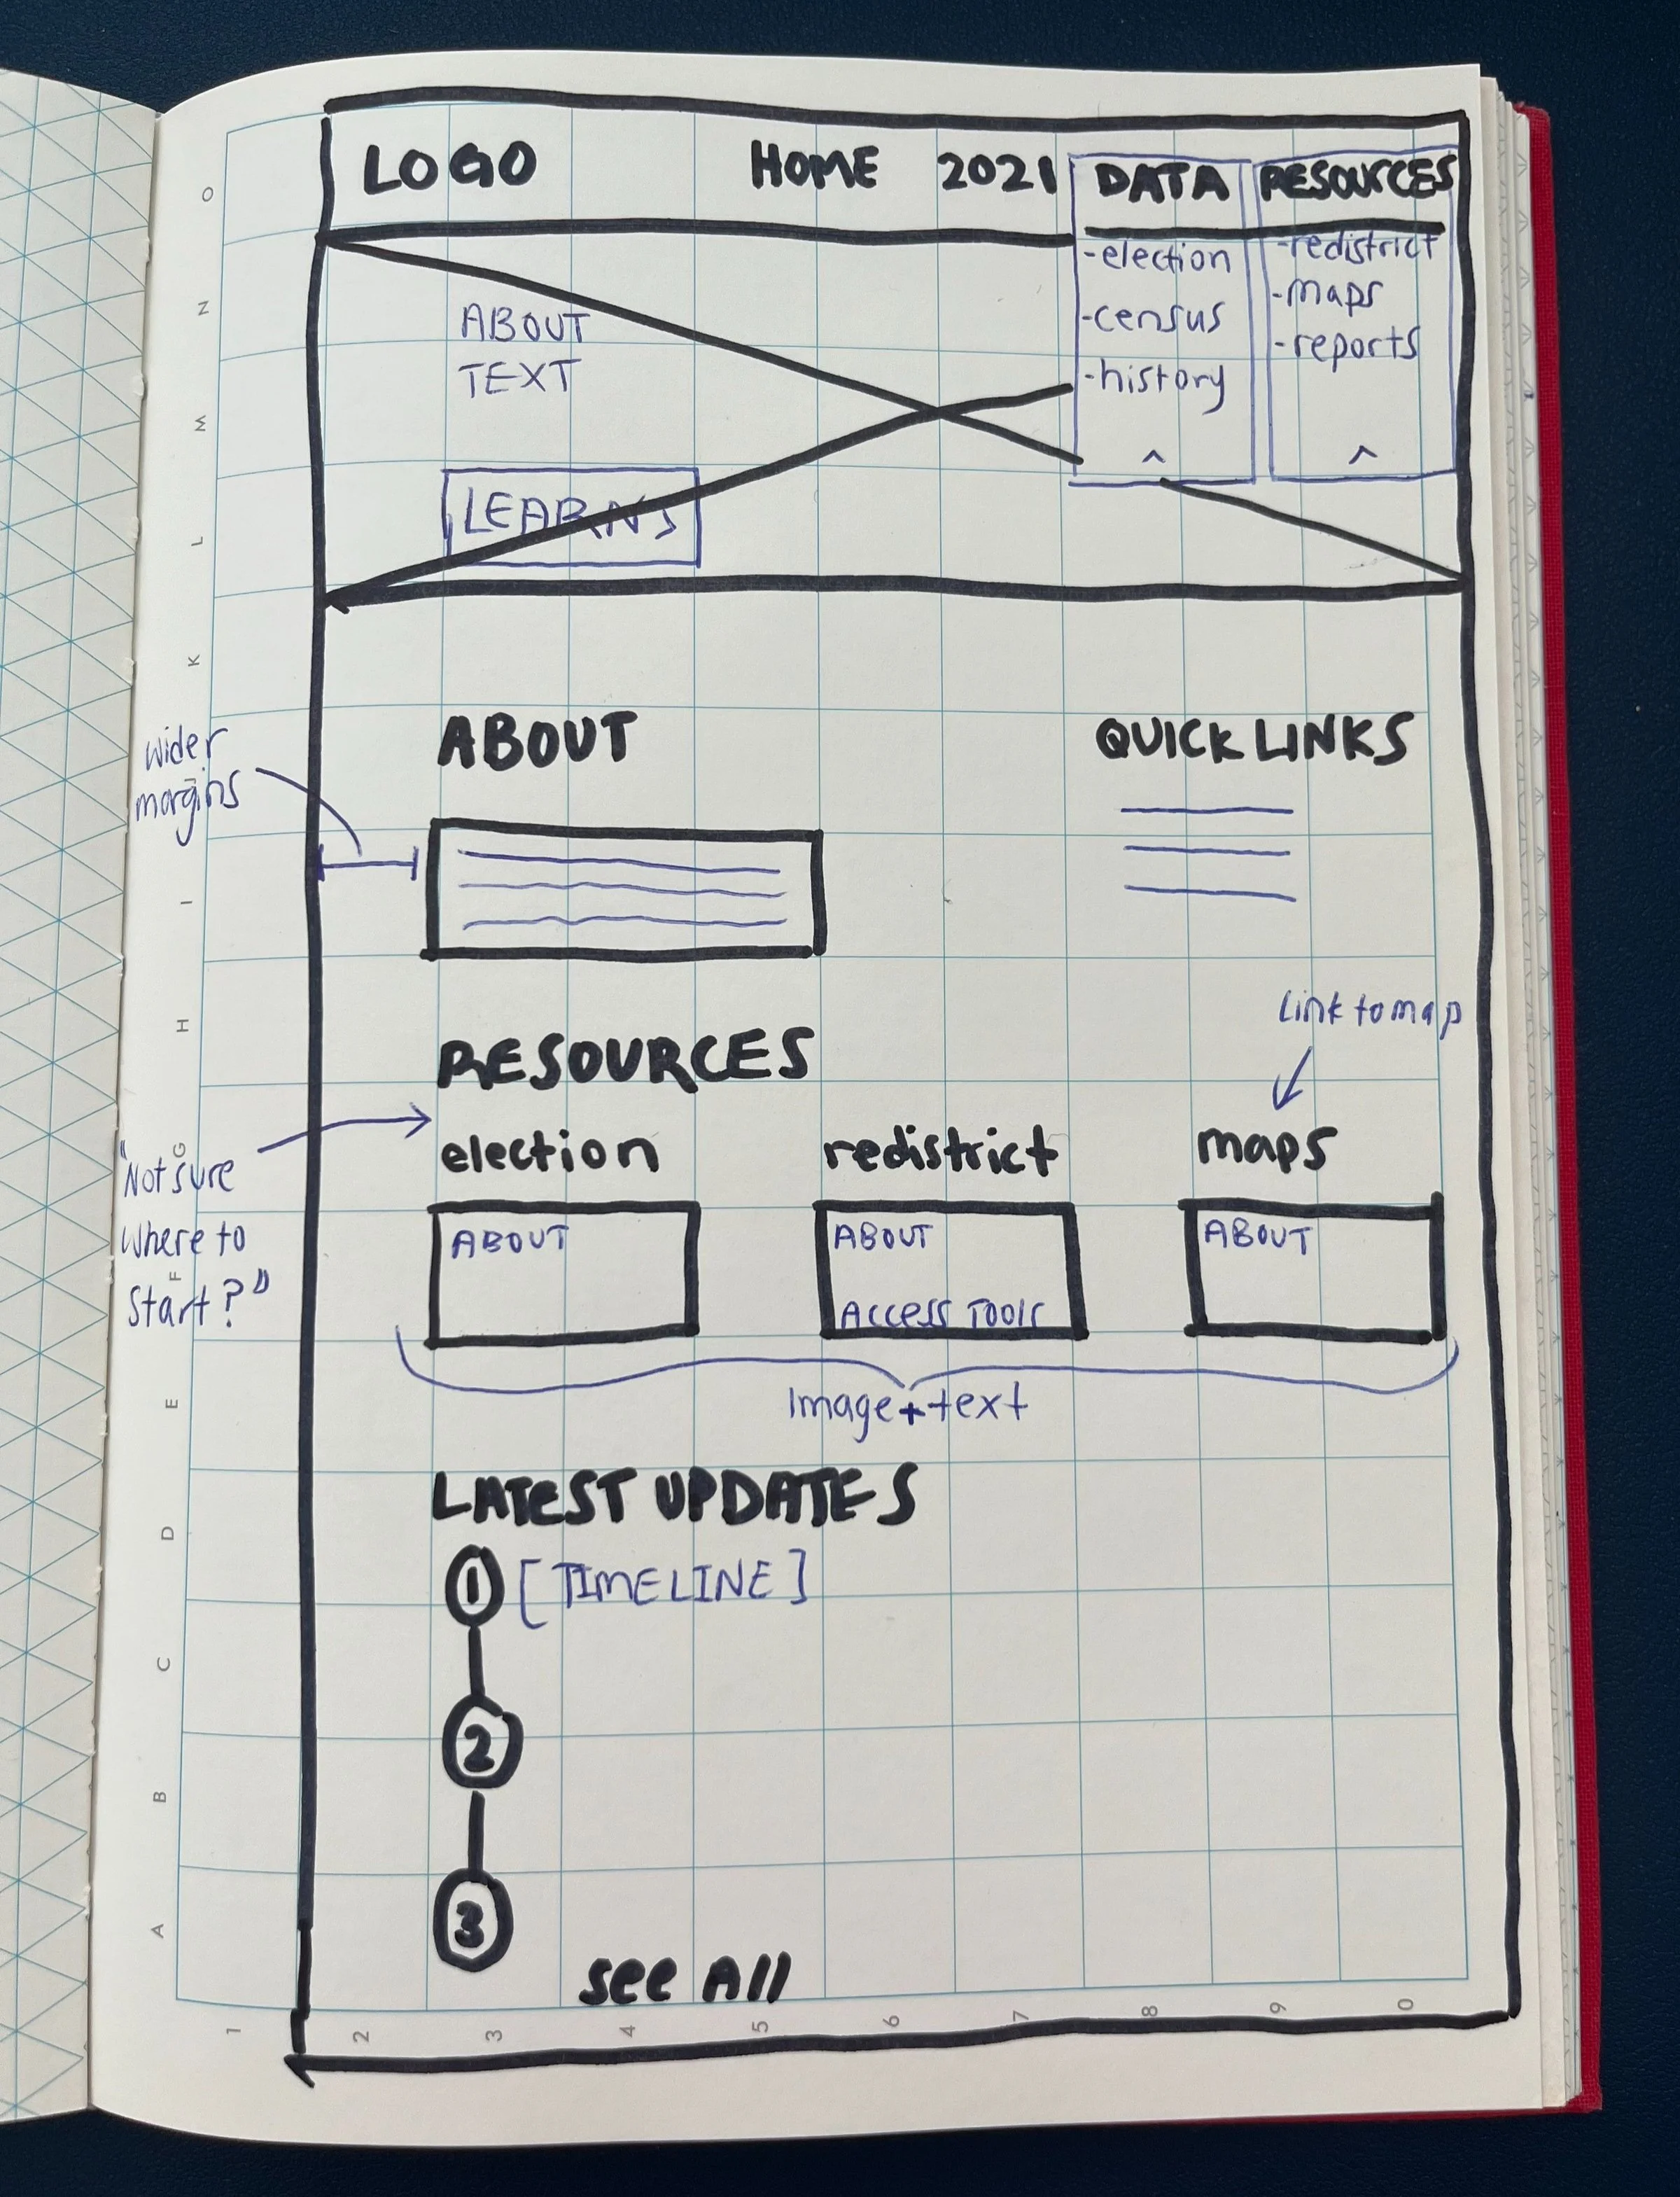
Iterative prototyping
Considering the research takeaways as MVP features, I sketched three homepage wireframes to discuss feasible redesign options as a team. We converged the ideas into one wireframe and translated it into a digital mid-fidelity mockup.
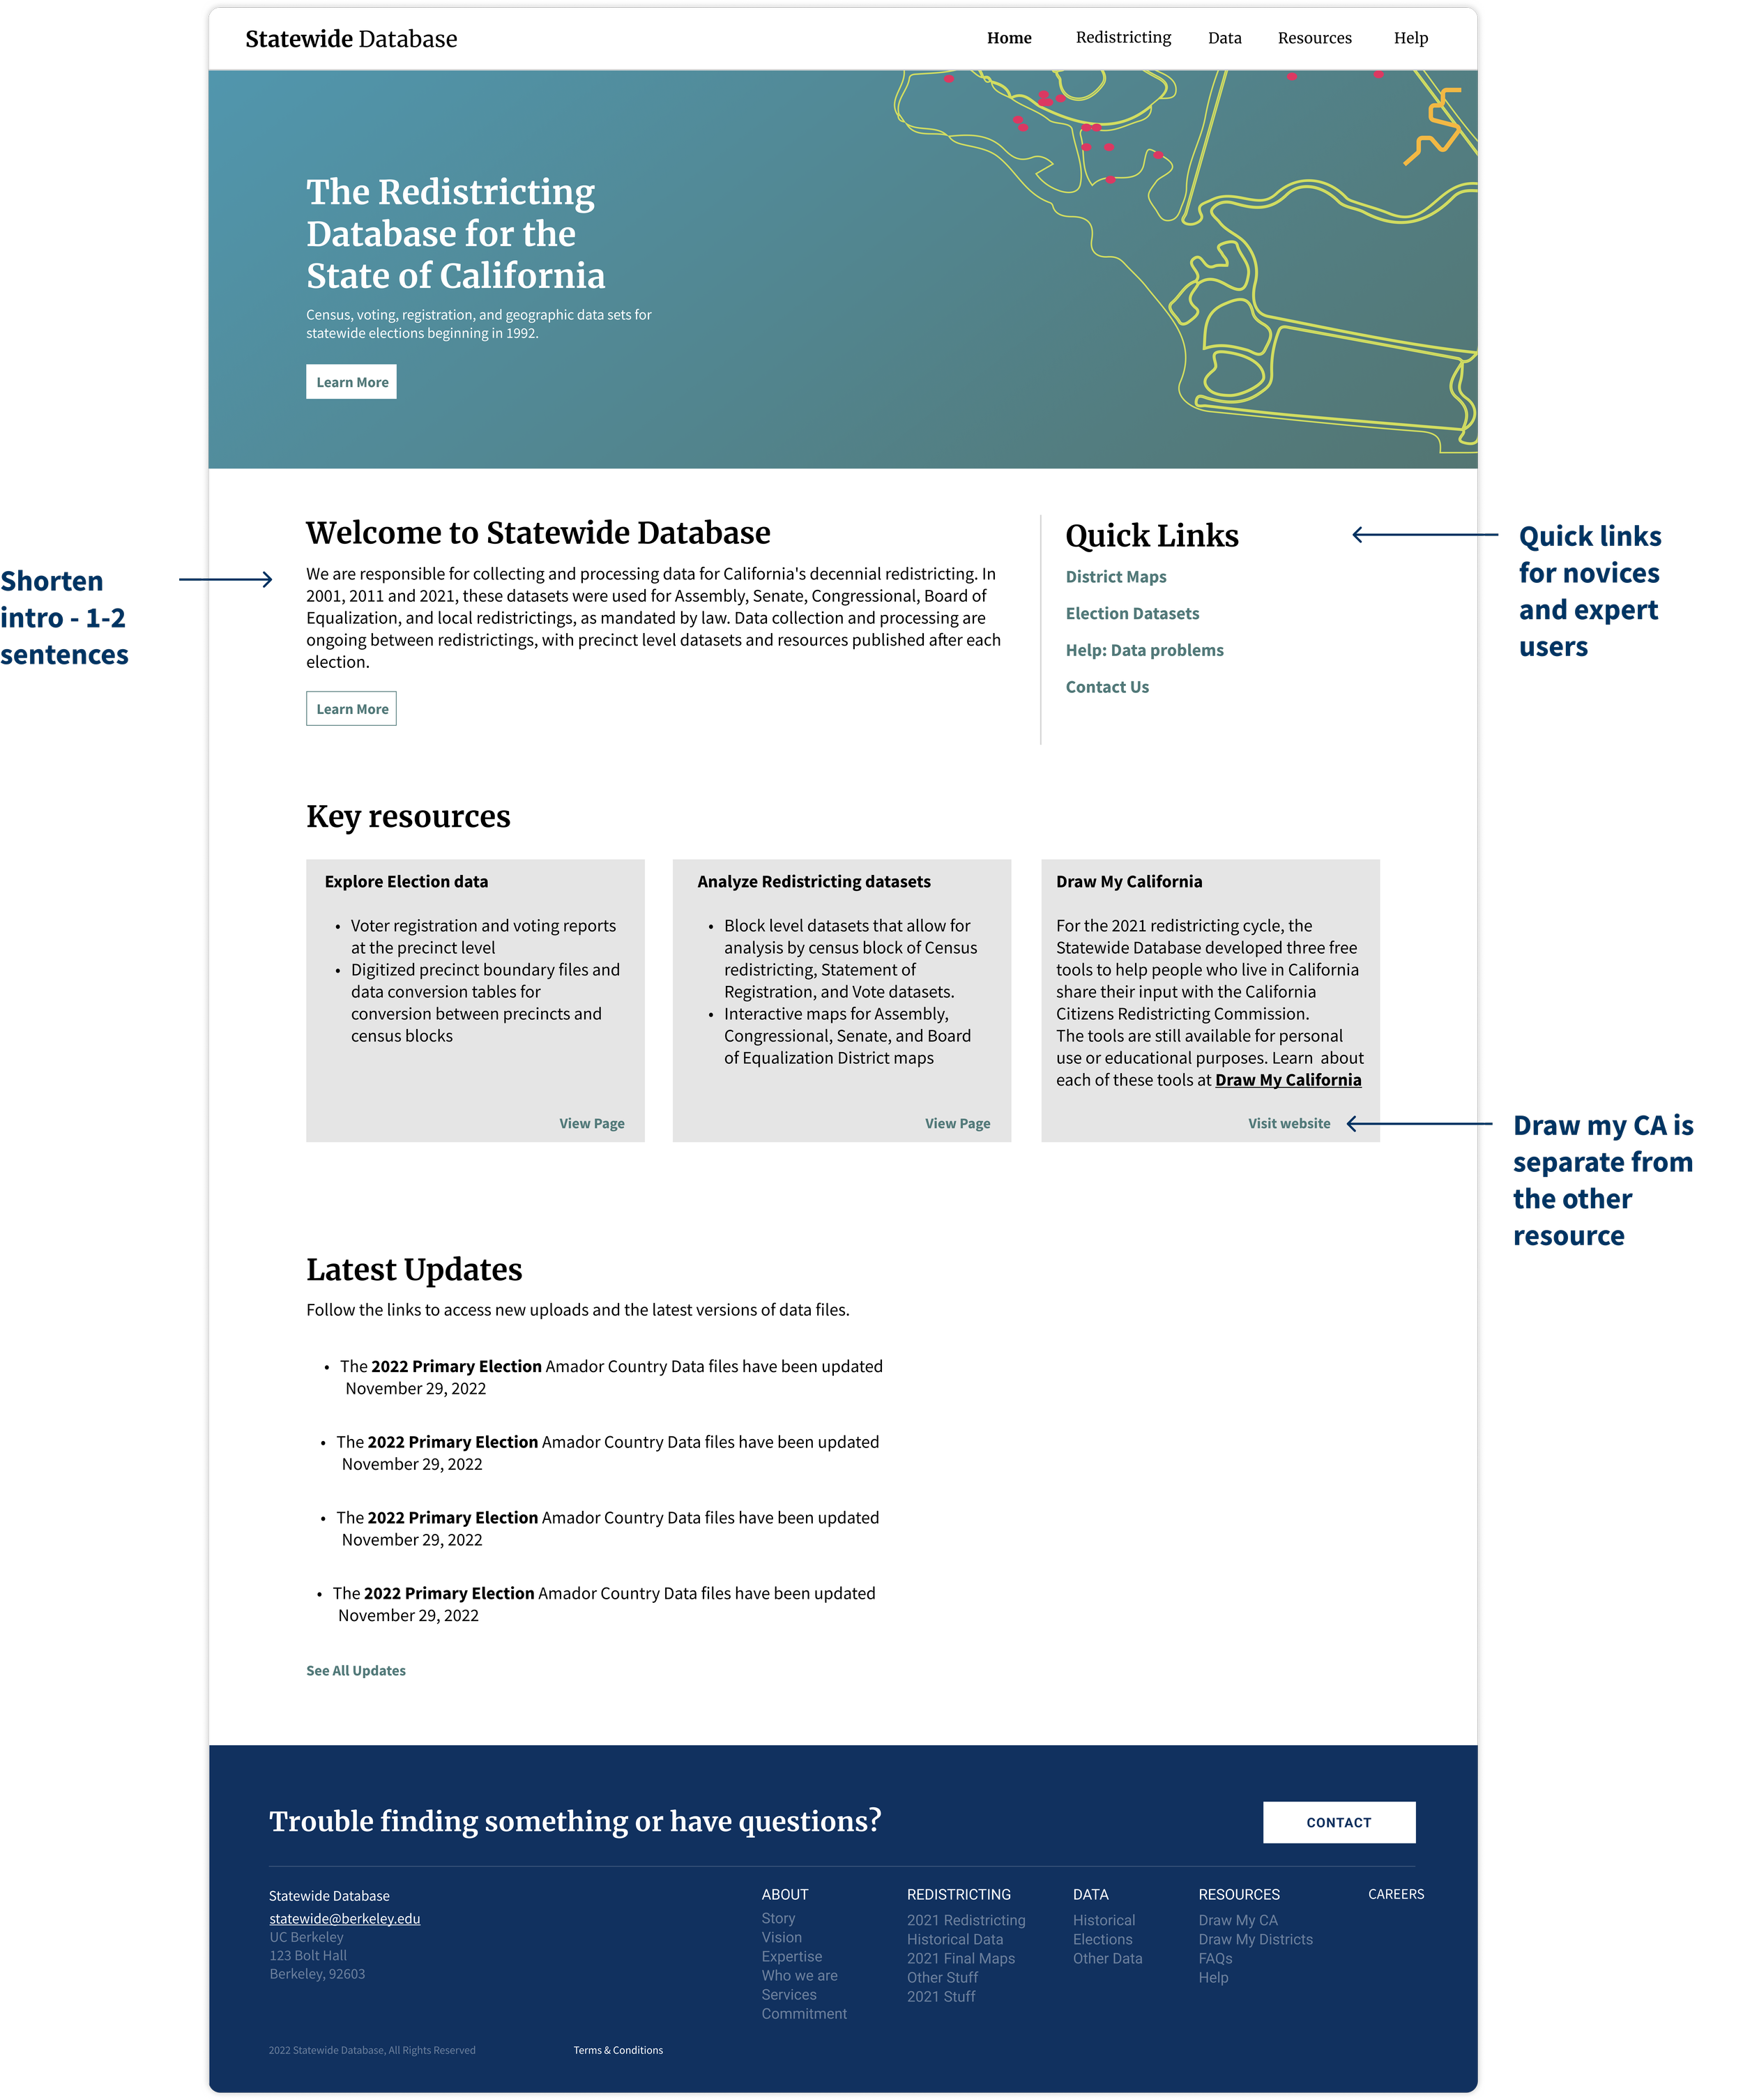
Usability test
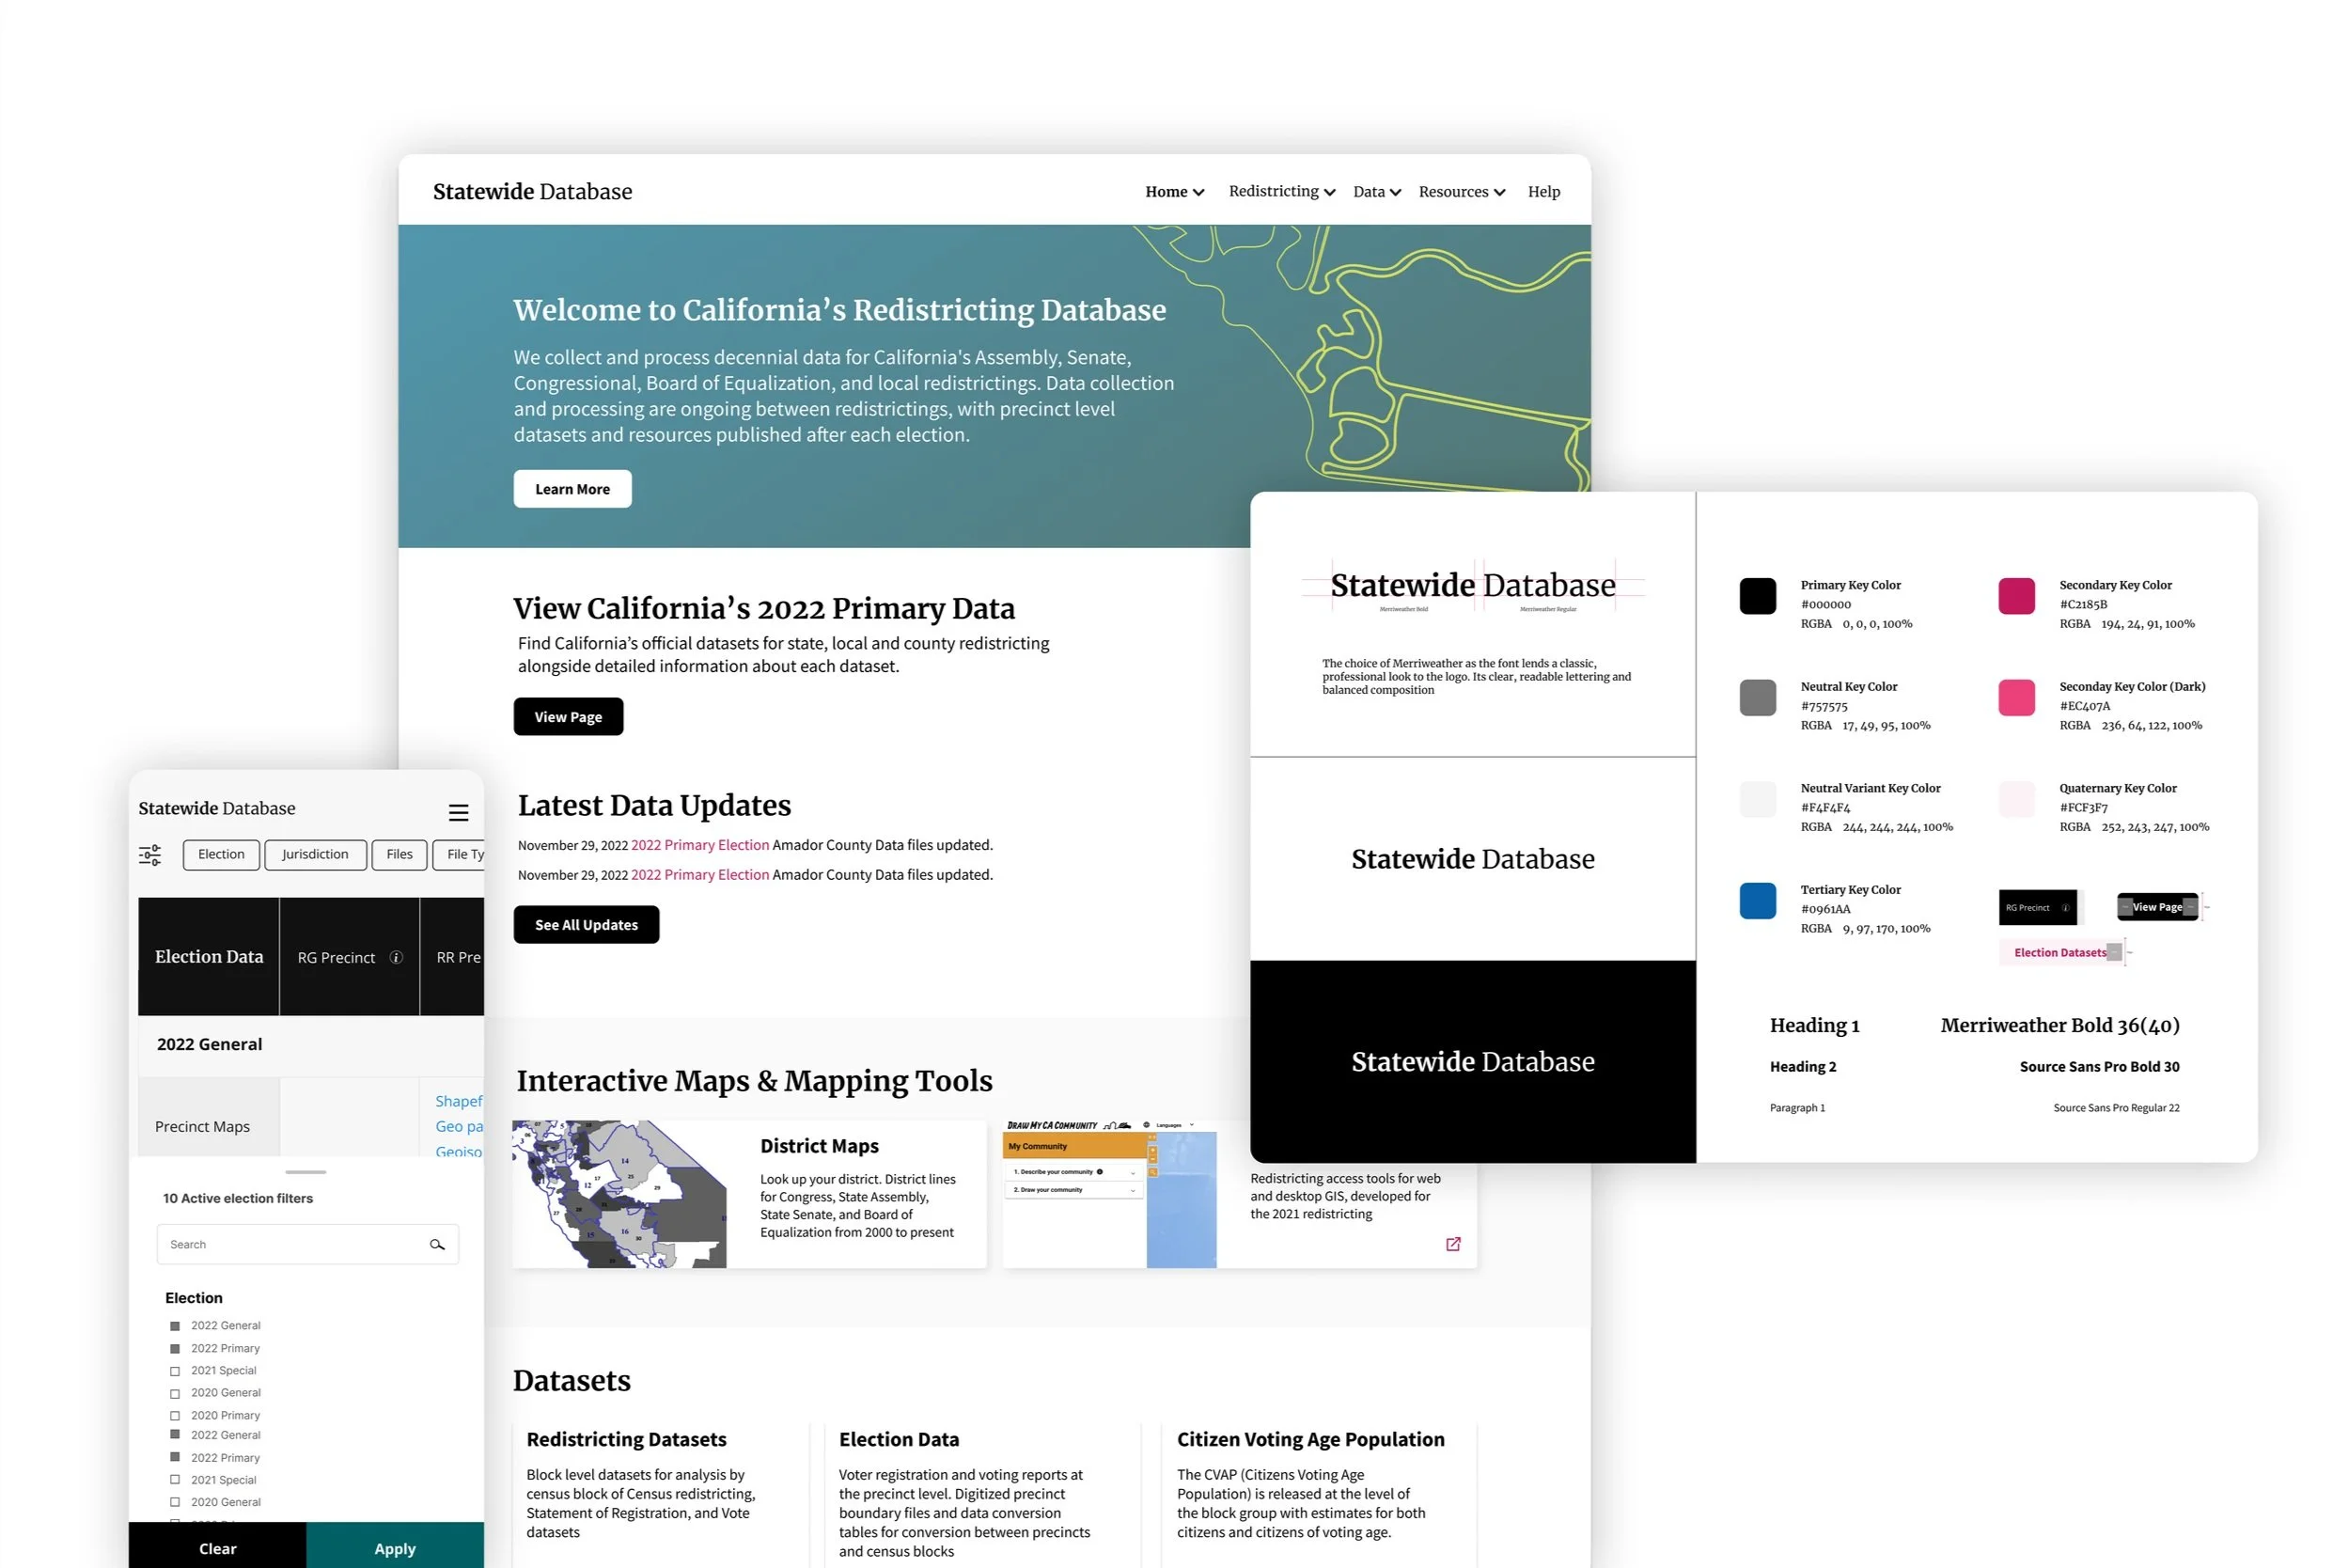
I collaborated with the team to iteratively develop a feasible high-fidelity homepage for usability testing with SWDB users, and integrated feedback to create a final version (pictured right).
Homepage adjustments, based on usability test findings
A/B test
During the second half of the usability test, I A/B tested two filterable table approaches for the Election Data page. The majority of participants preferred the above-table filter version because it aligned with their mental model for filtering data (versus side filter which was associated more with activities such as online shopping).
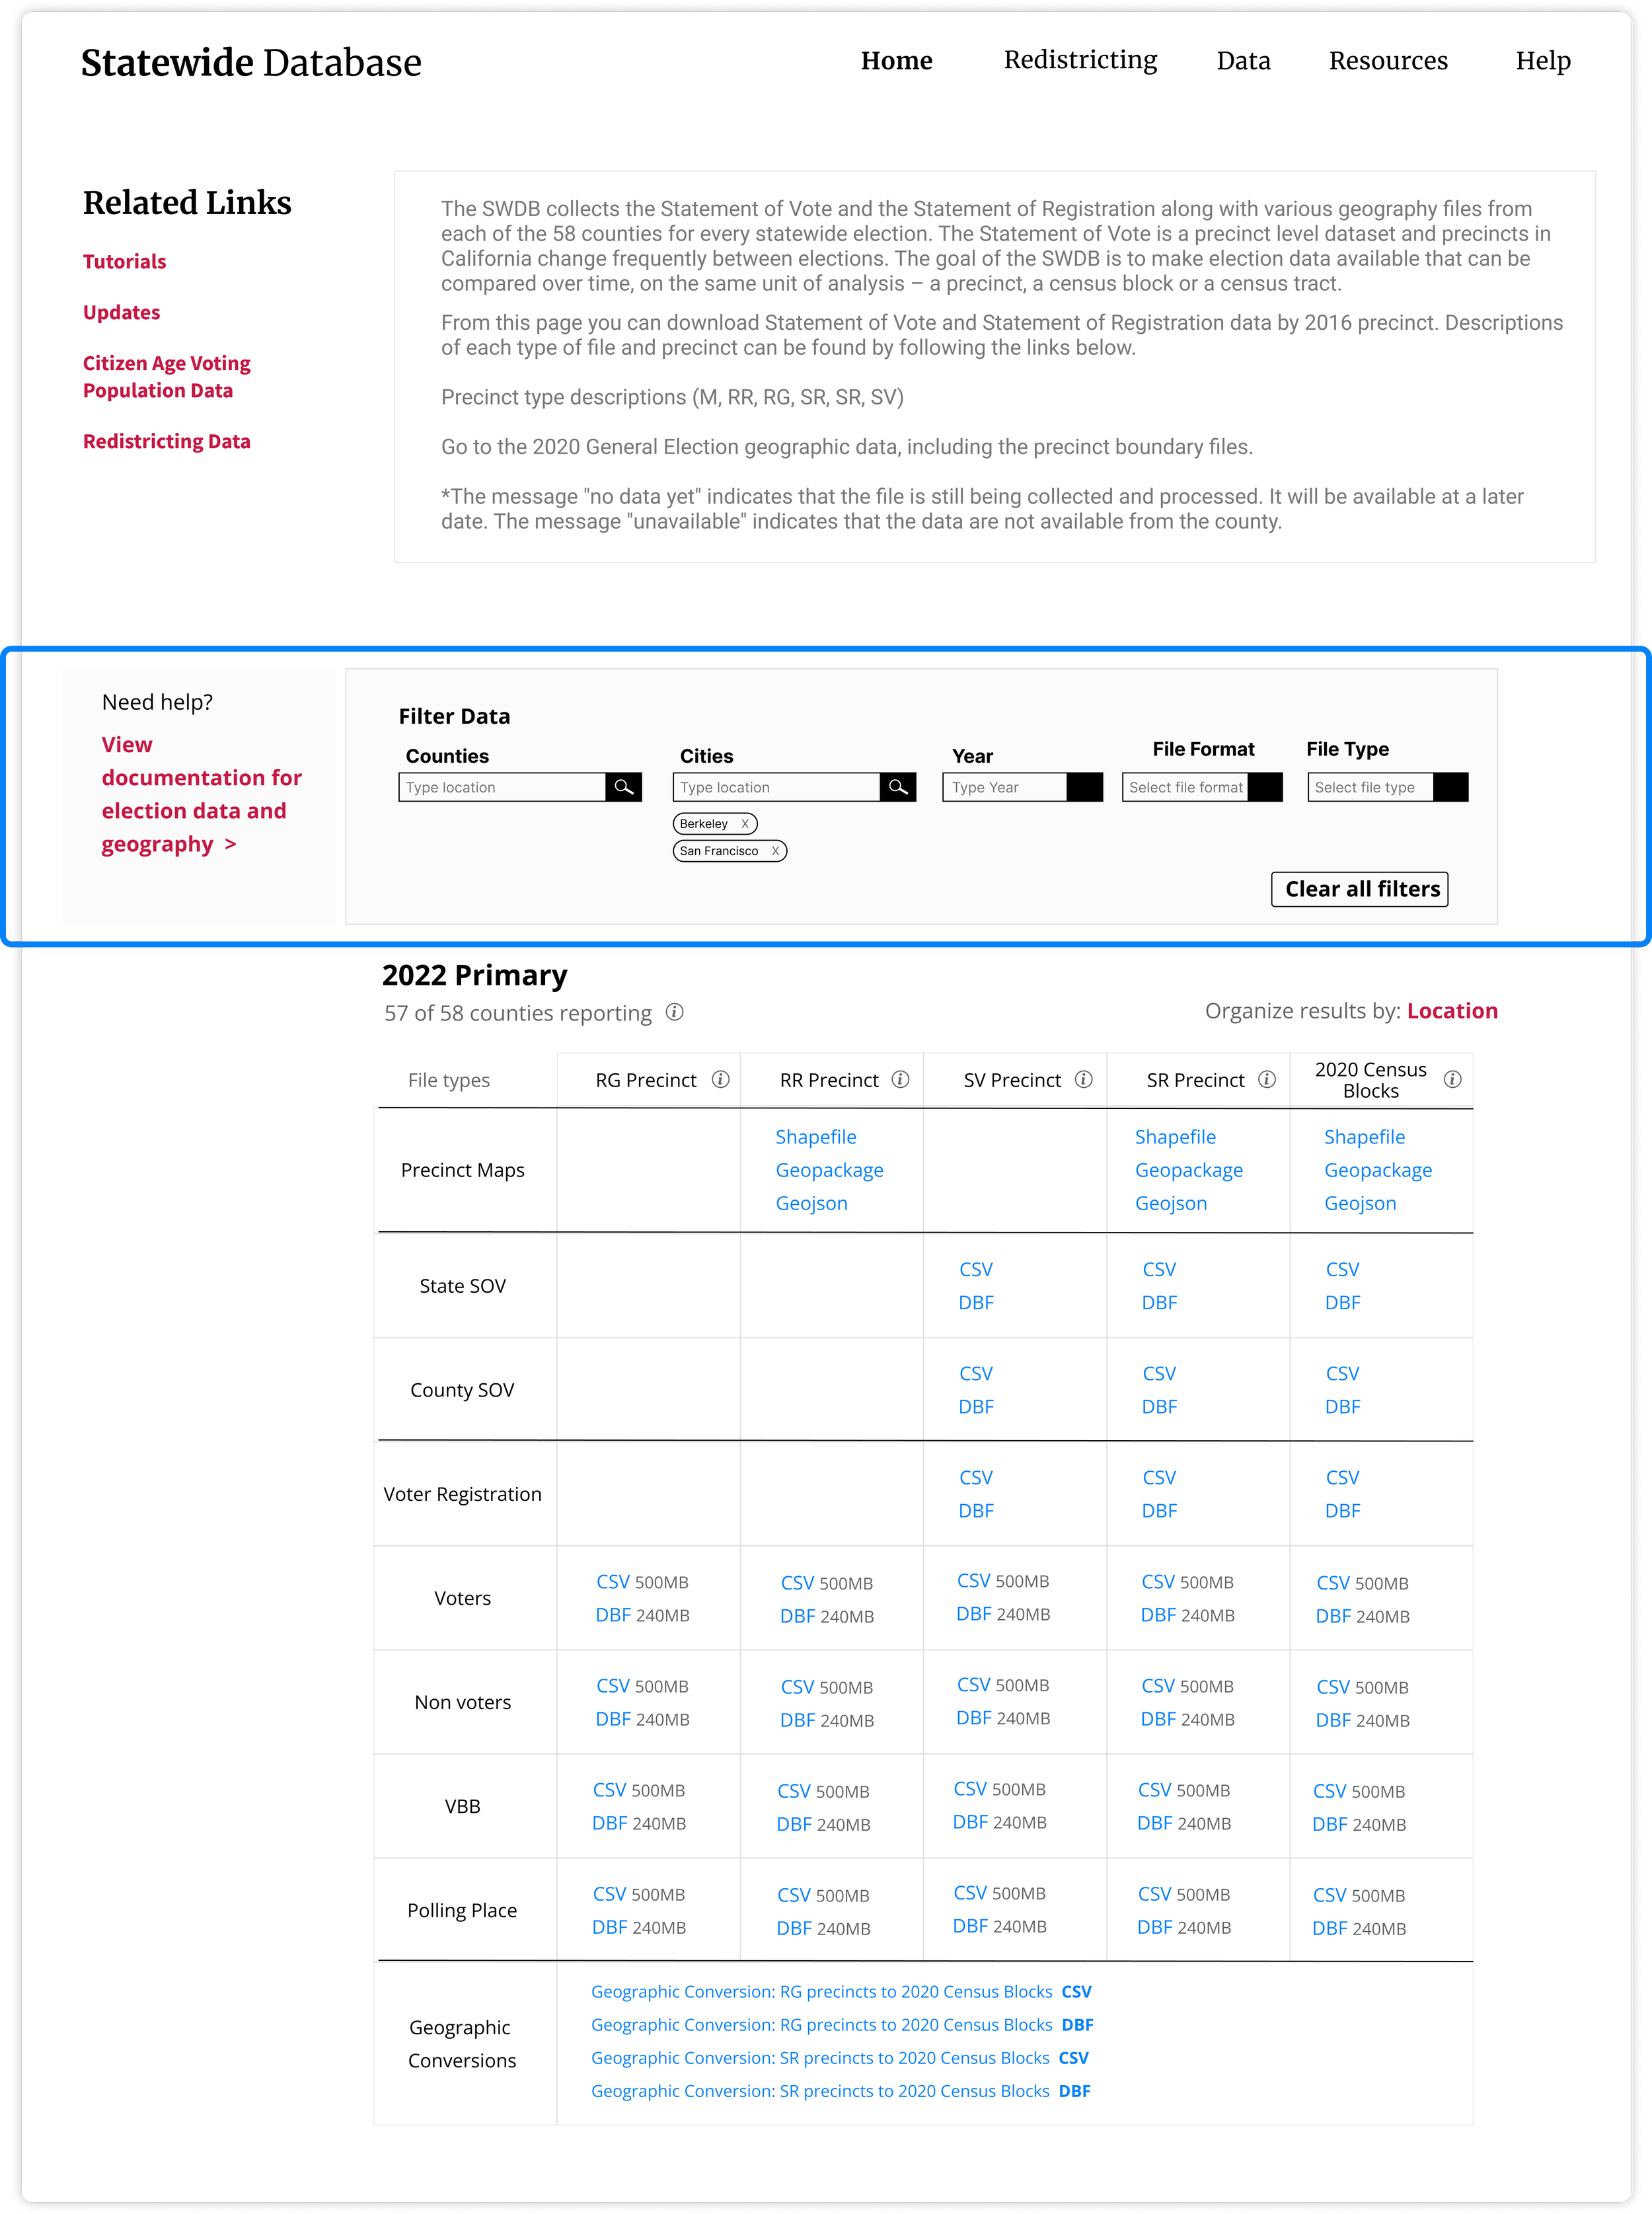
Data page A: top filter (4/5 preferred)
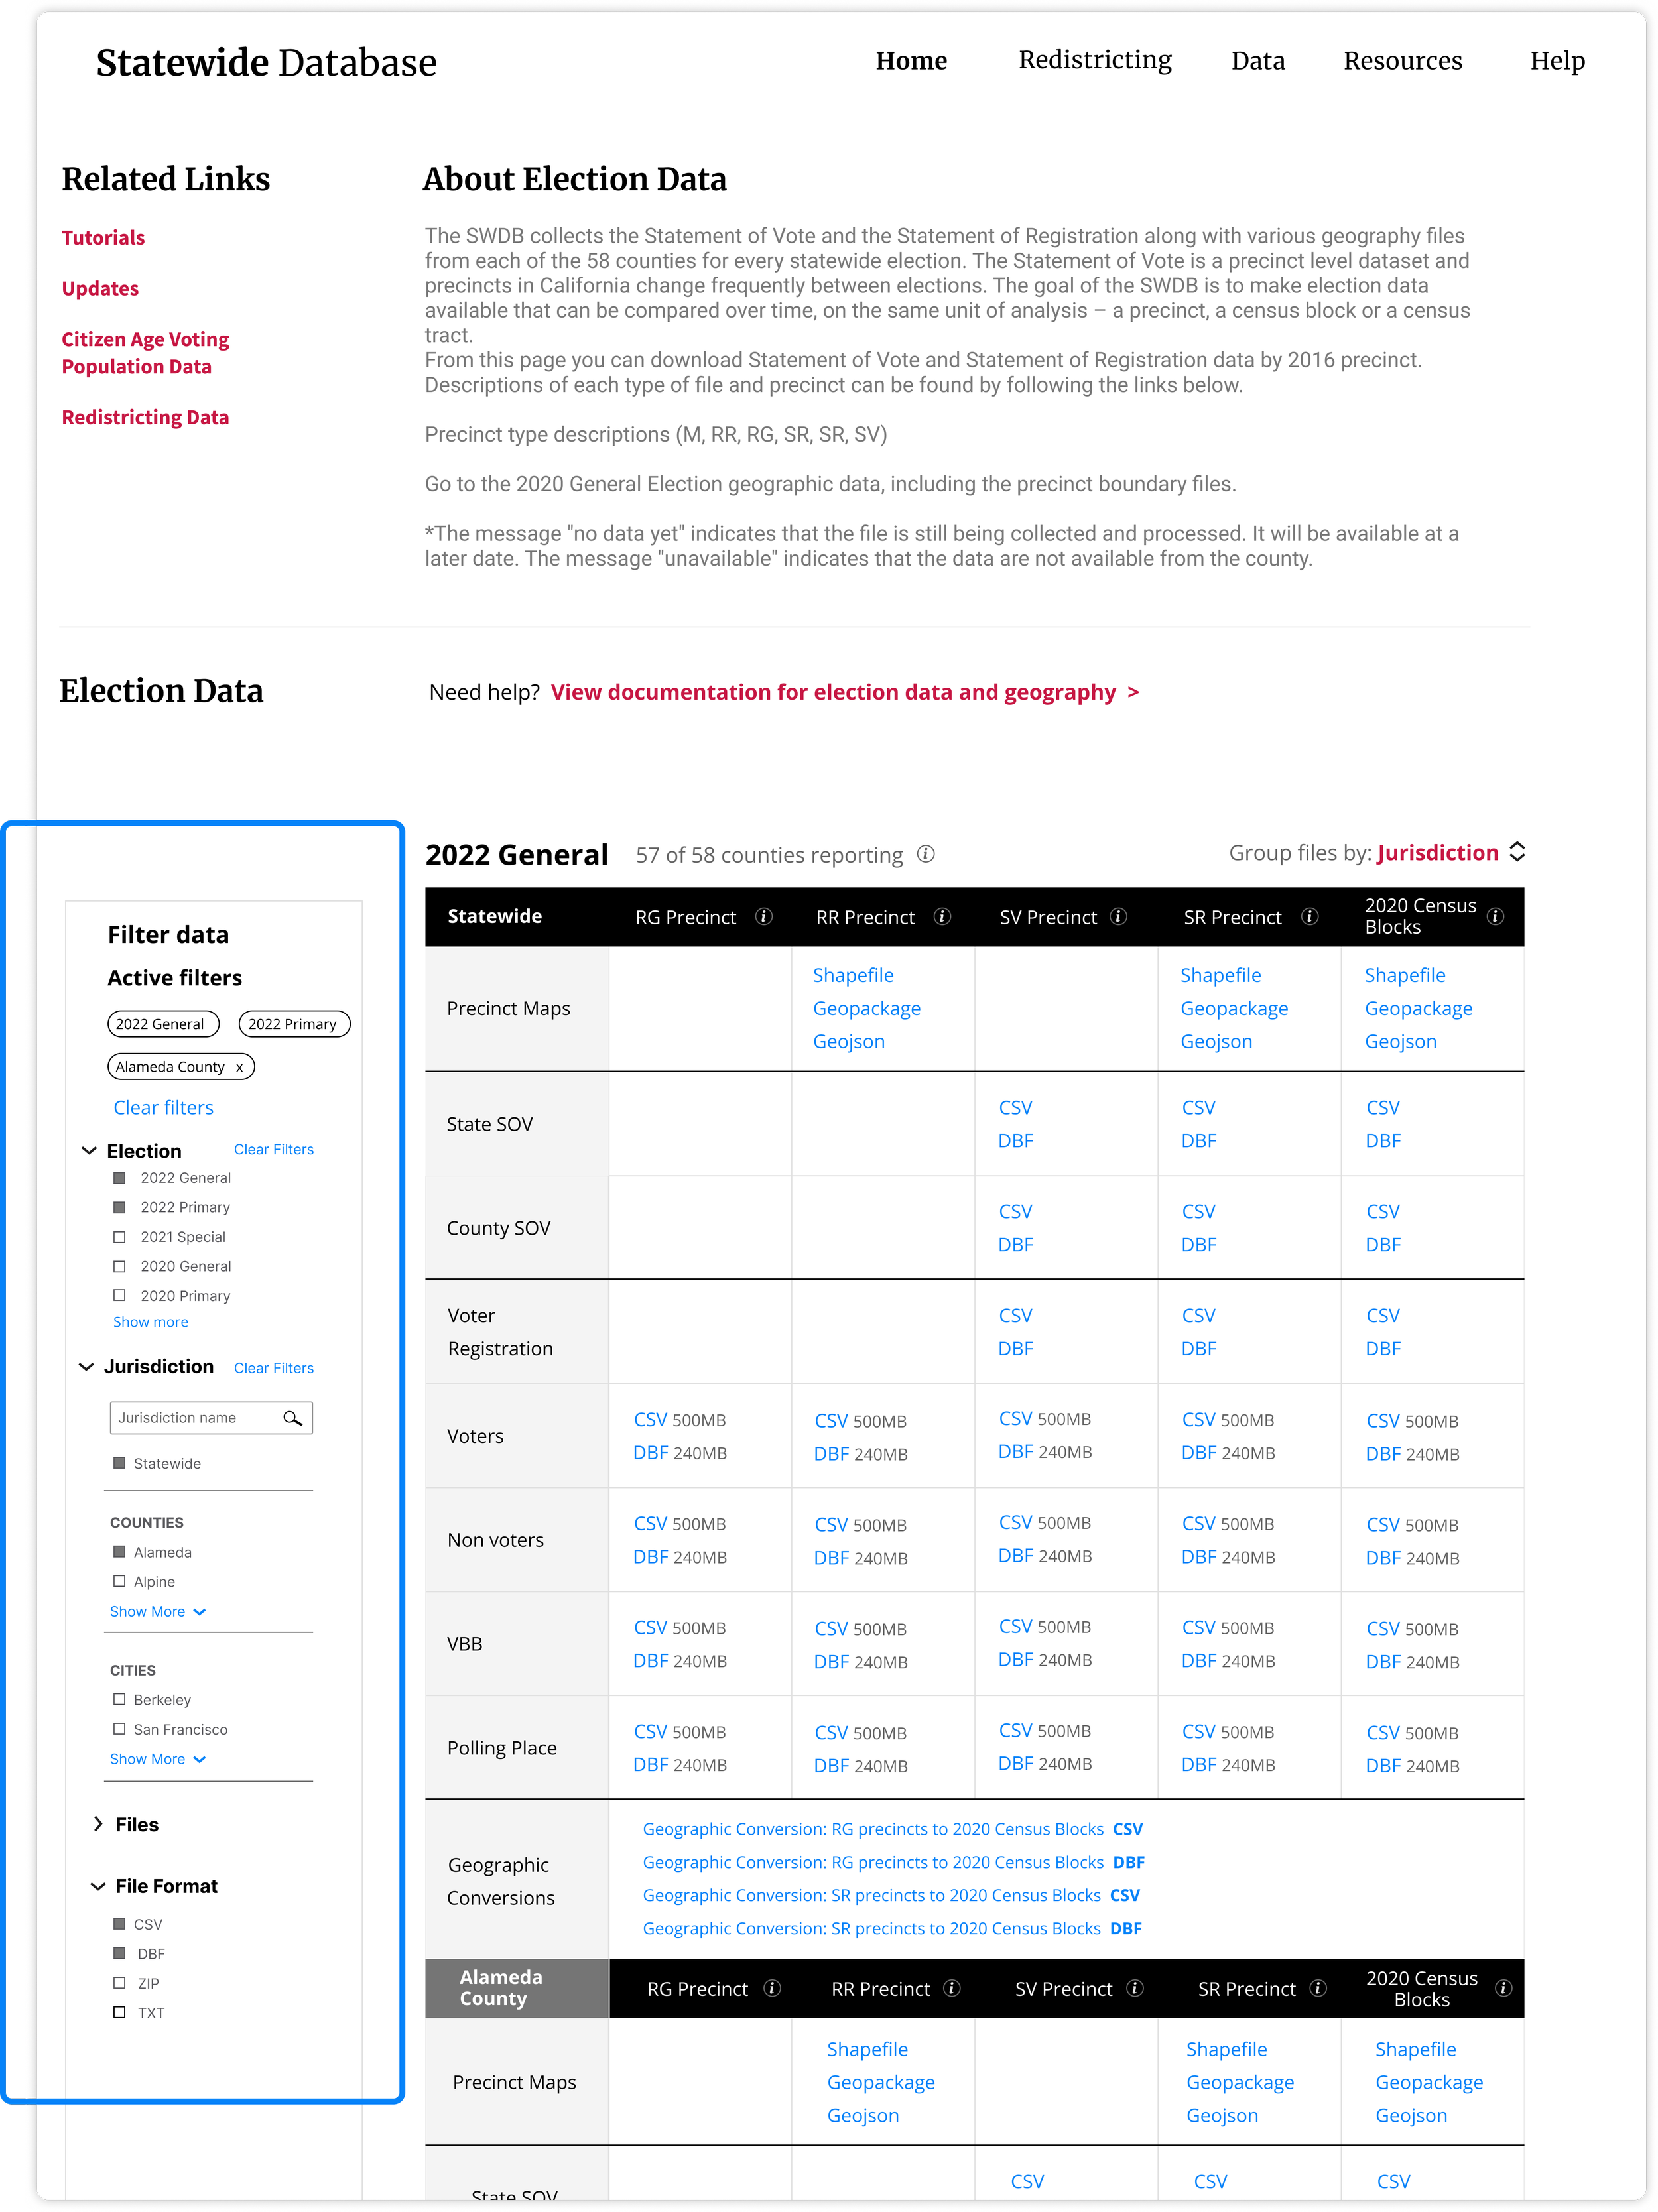
Data page B: side filter (1/5 preferred)
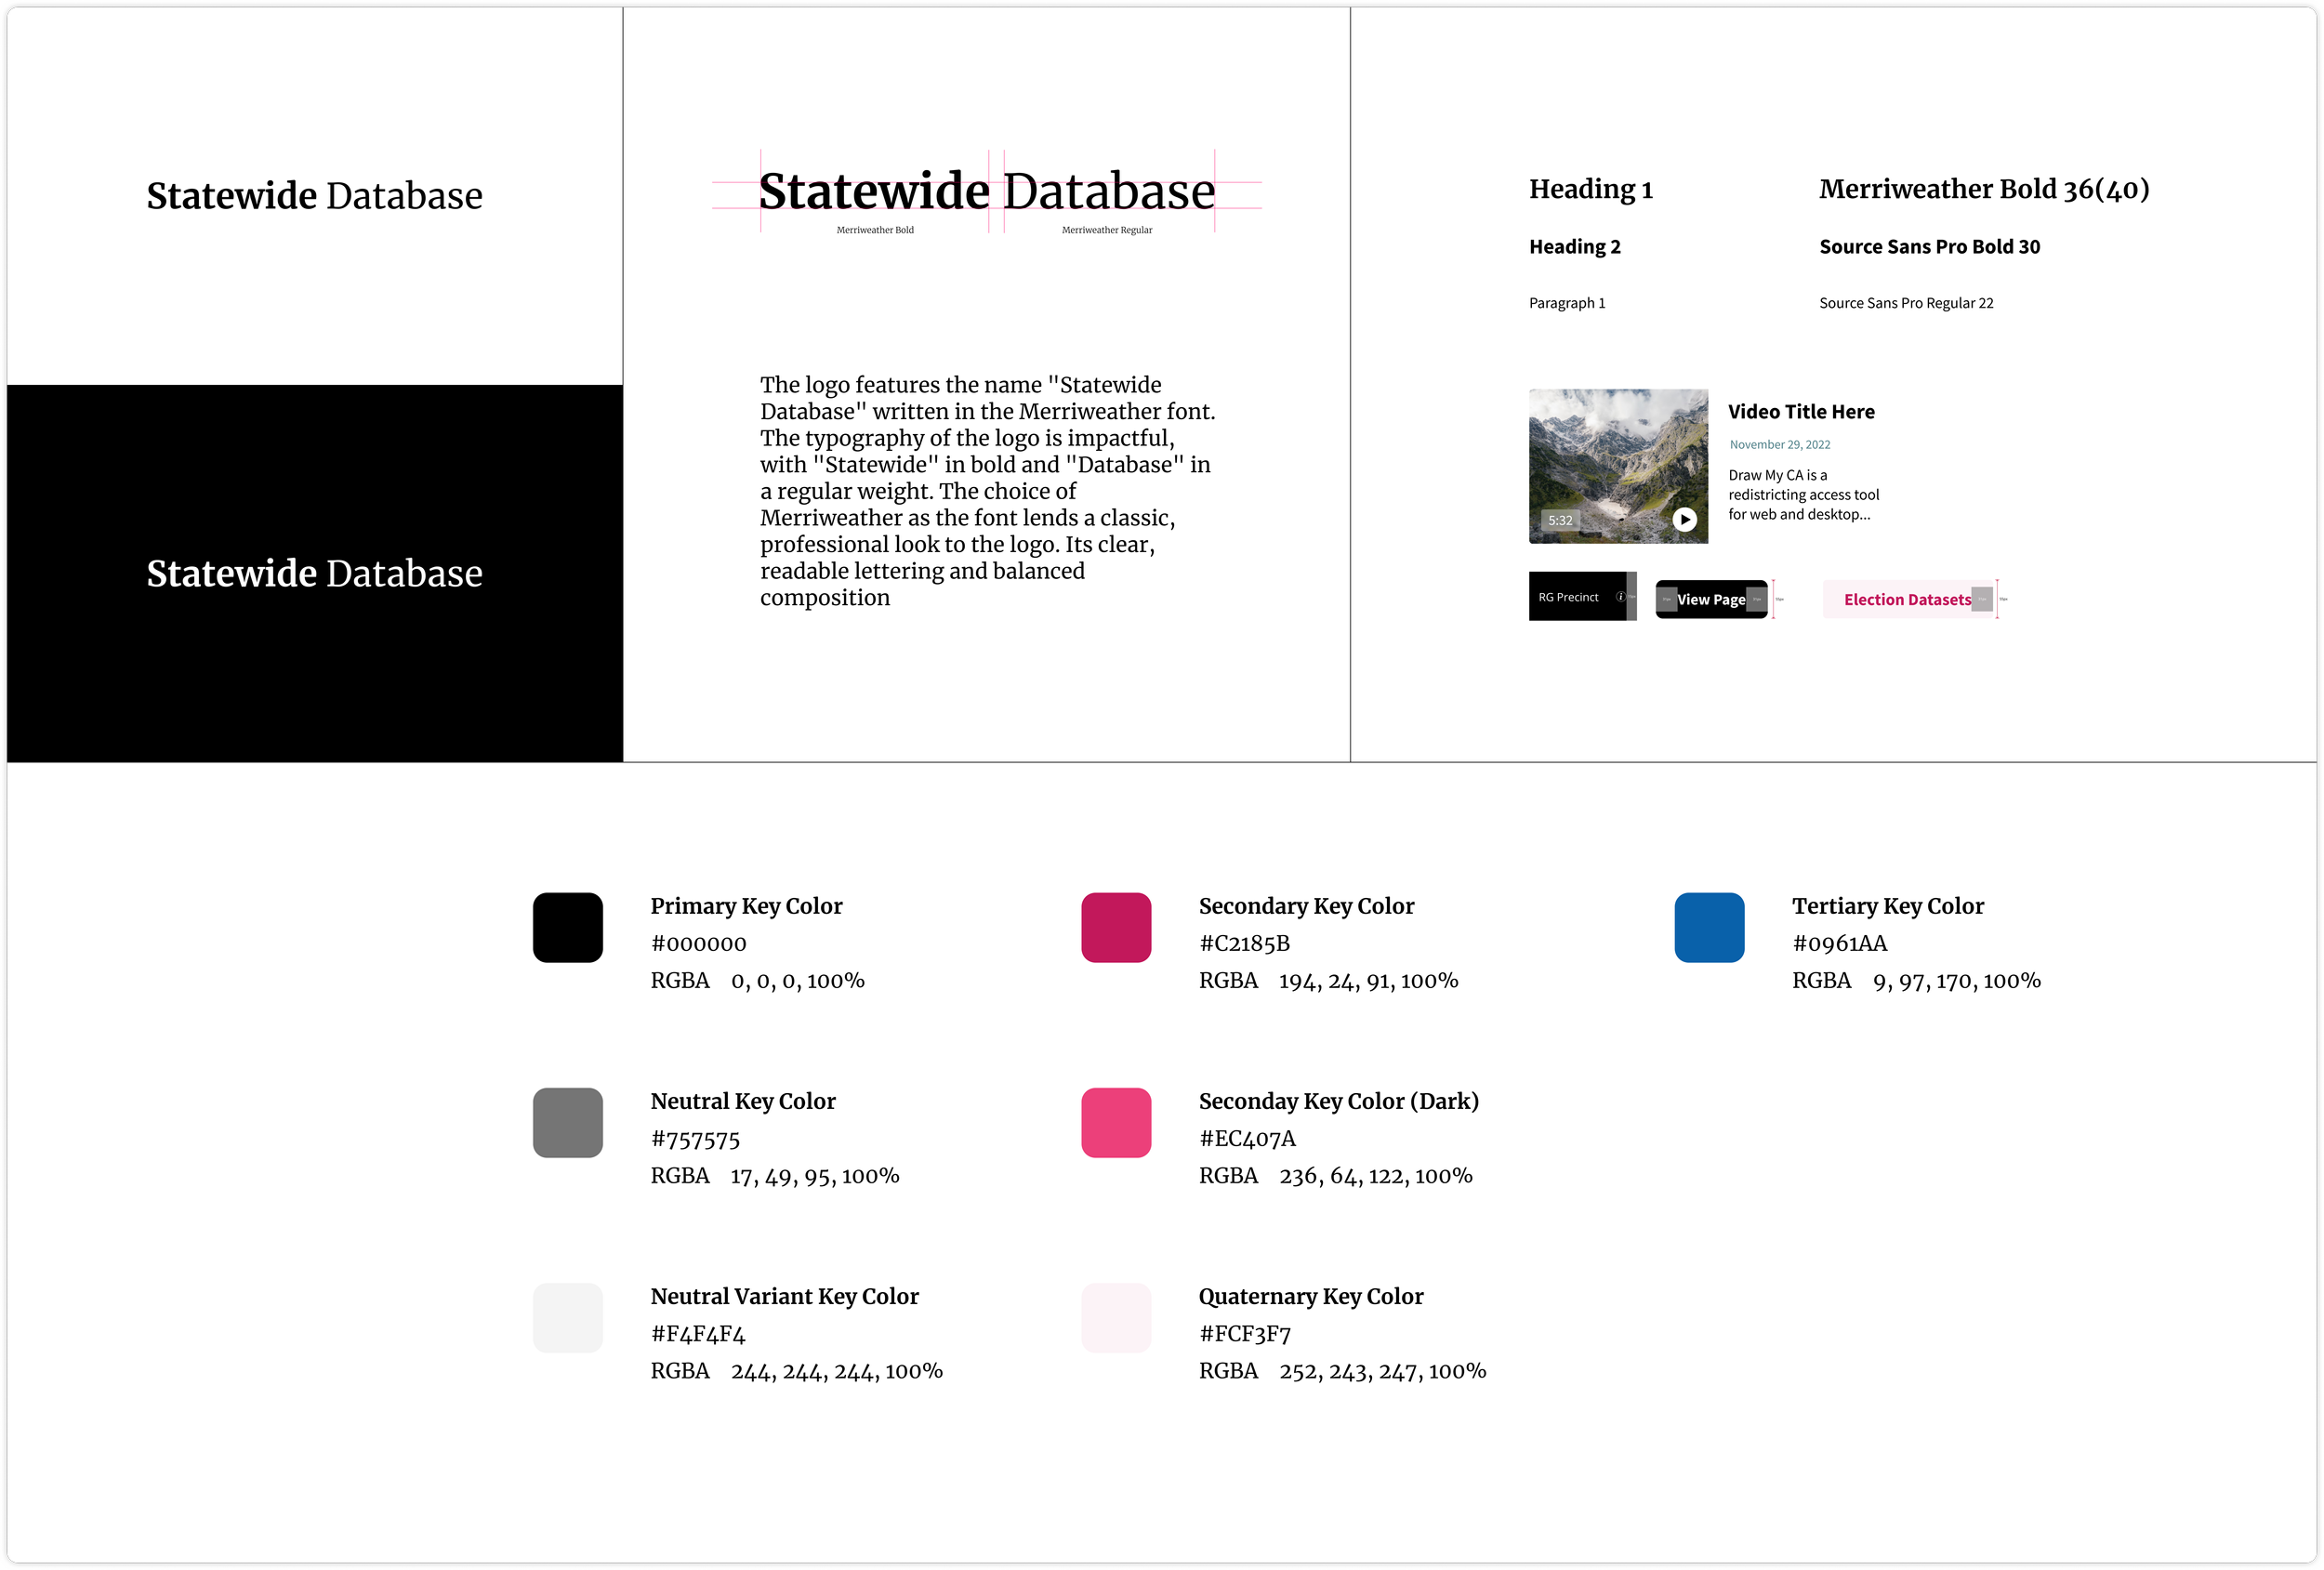
Style Guide
I compiled the website colors and components I had been using into a style guide to maintain future design consistency .
Mobile prototype
Finally, I adapted the latest prototype for mobile.
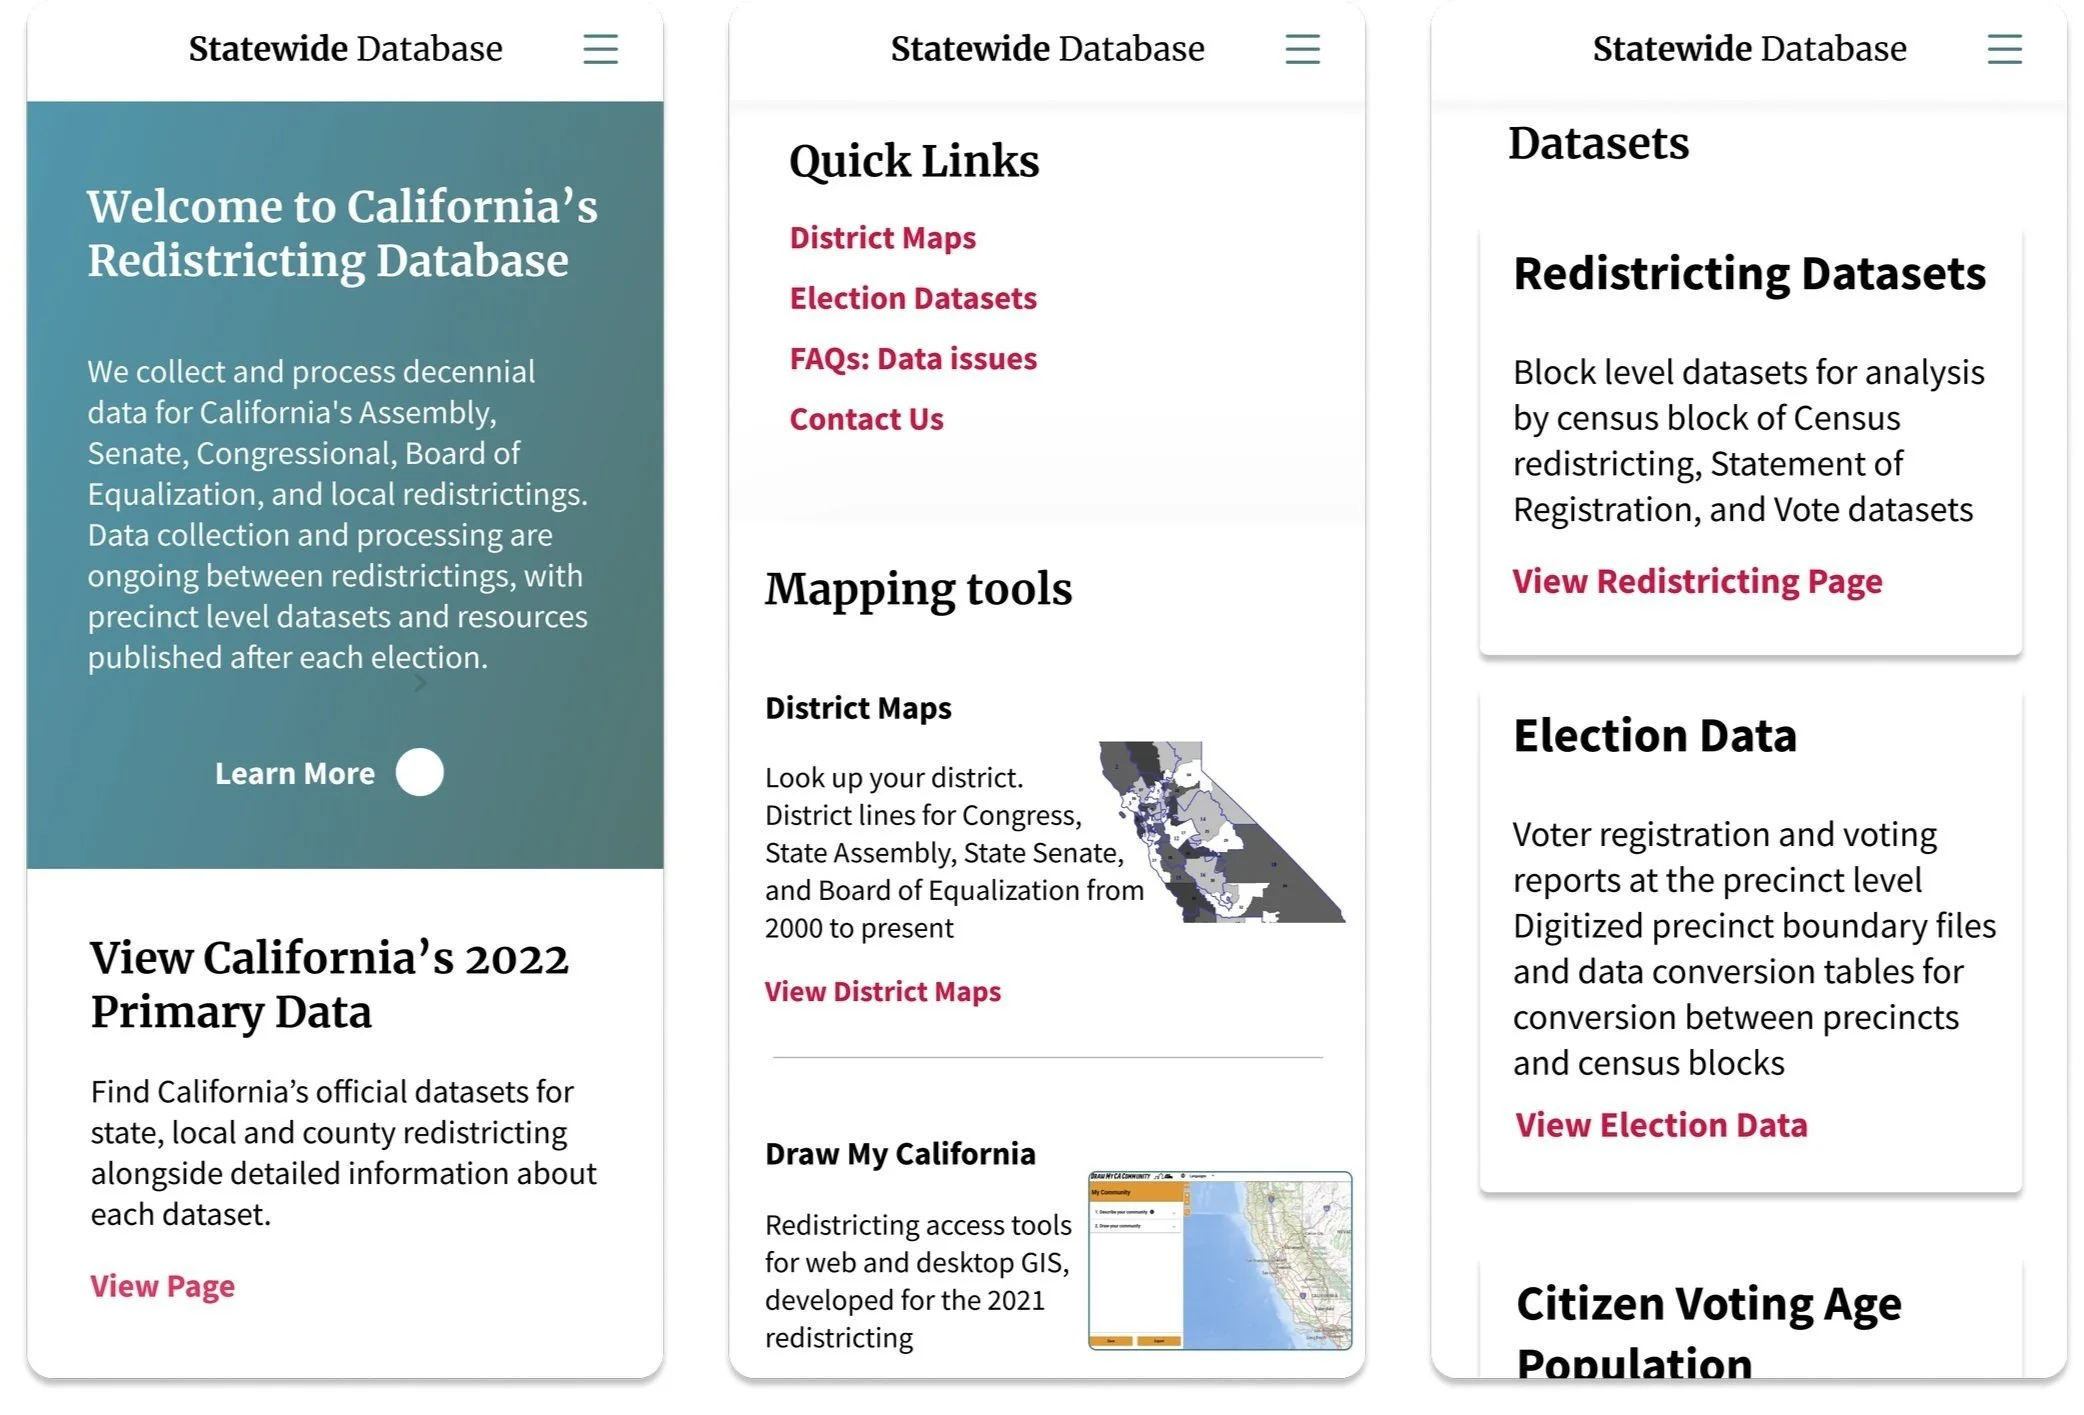
Homepage
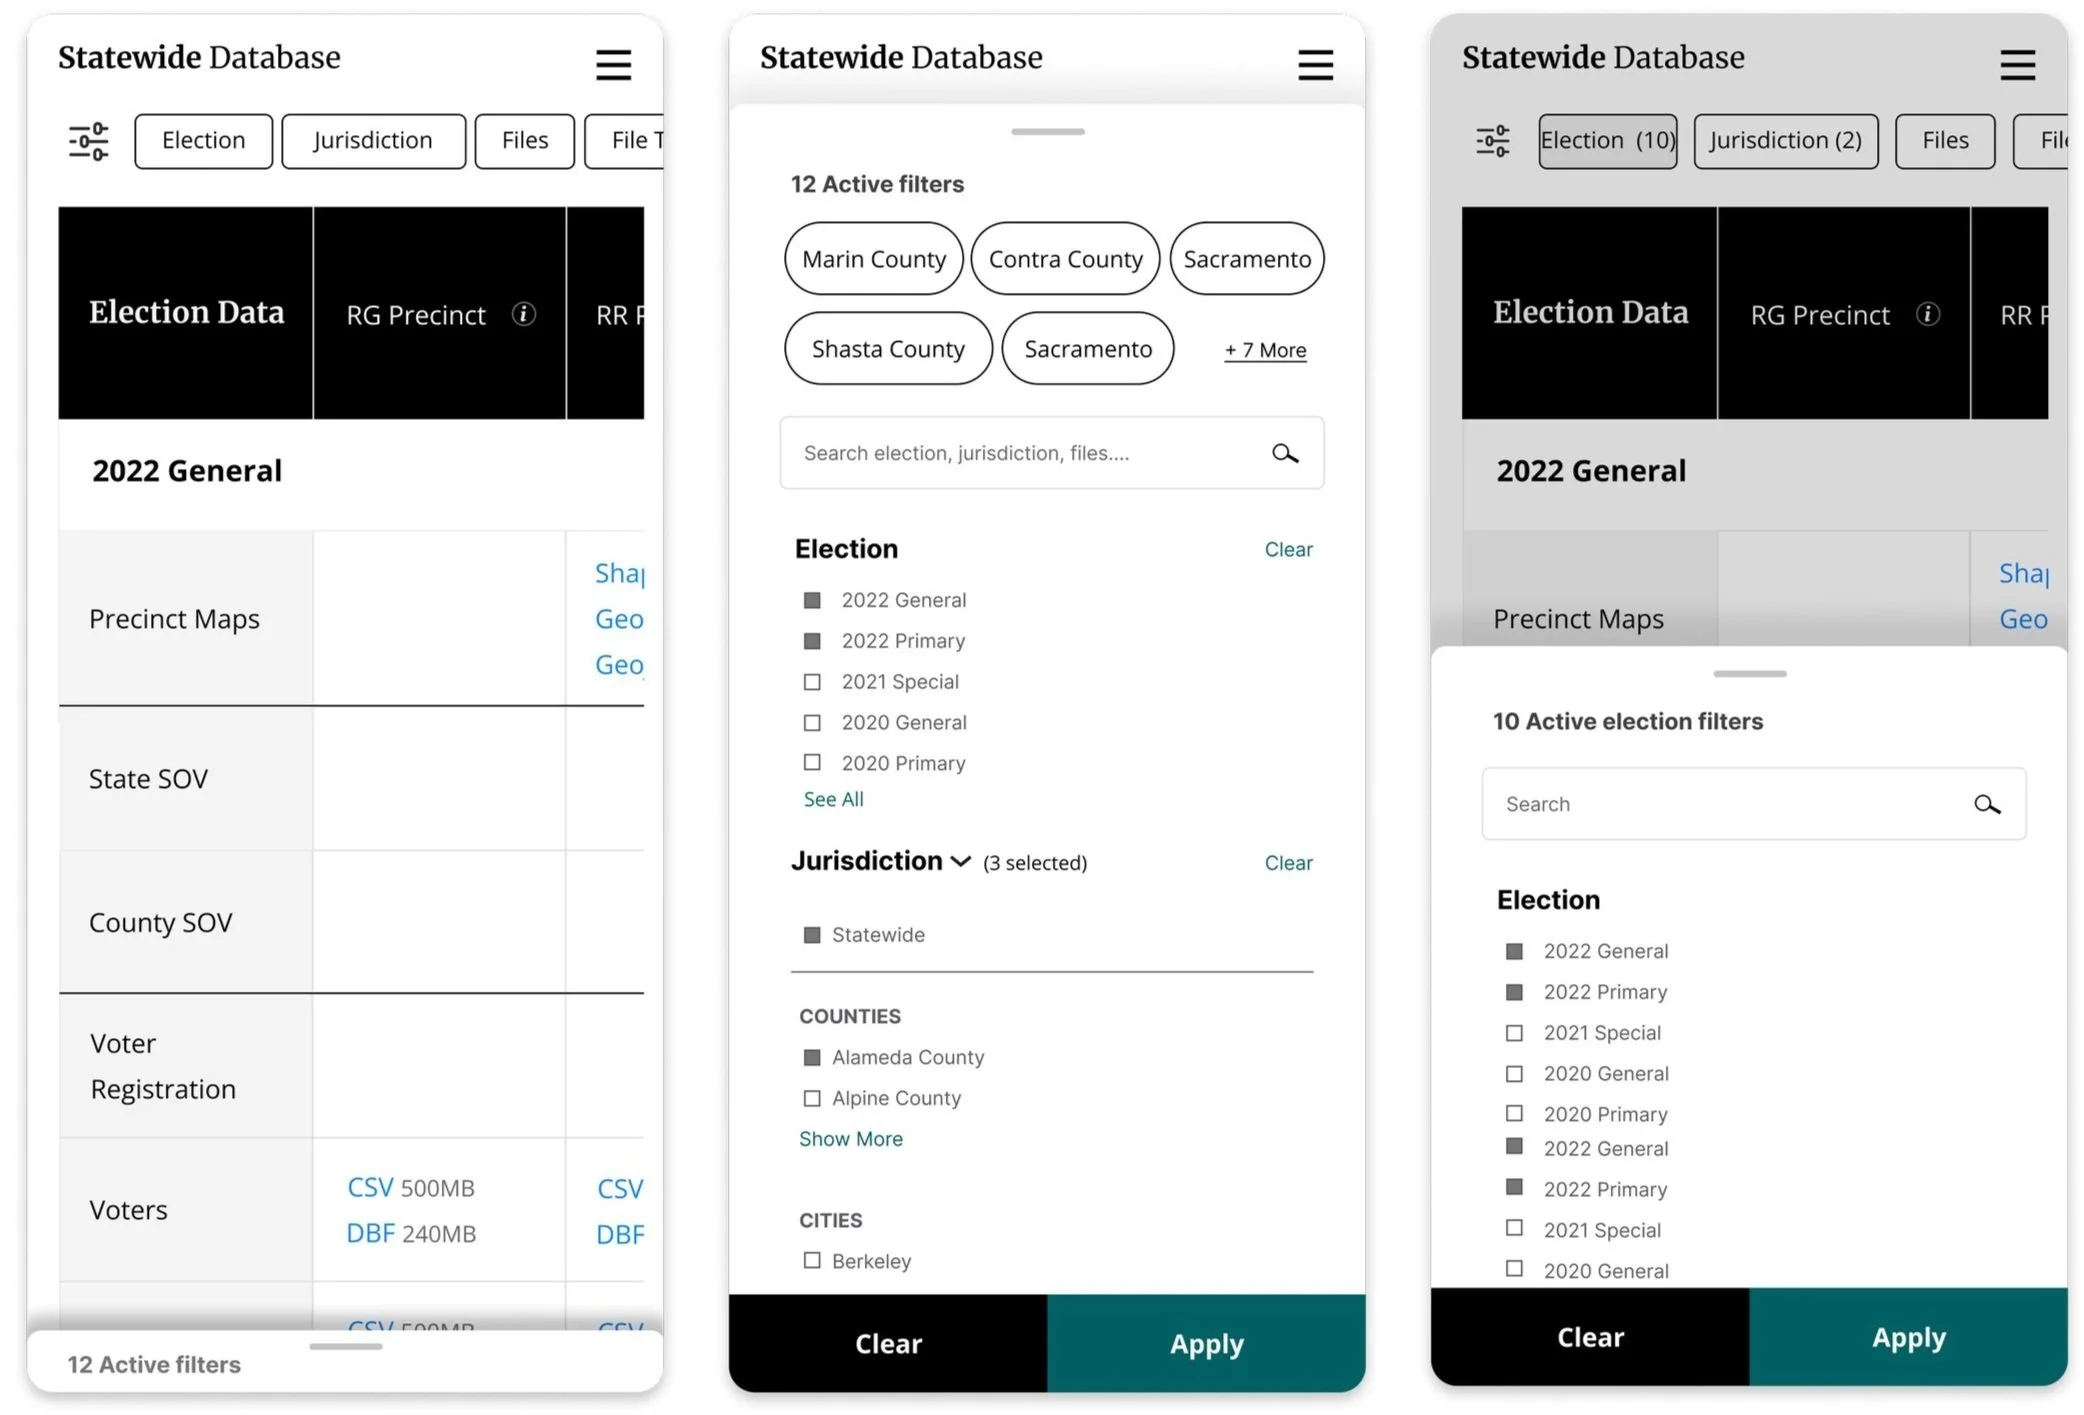
Datapage
Reflection
This project reinforced the value of iterative design in translating complex, data-rich content into interfaces accessible to both novice and expert users. A deliberate design decision was made to restrain the visual complexity of the data table page, prioritizing clarity and long-term usability over aesthetic ambition — ensuring the organization could confidently maintain and build upon the work independently after our engagement concluded.